Diggy Digs Data
  • Datasets
  • About
Categories
All (7)
Analytics (4)
API Documentation (1)
Consumer Tech (1)
Copywriting (1)
Data Engineering (1)
Ecommerce (1)
Football (5)
Marketing (1)
Penalties (1)
Plotly (1)
Python (4)
R (1)
Running (1)
Strava (1)
Technical Writing (2)

Screenshot of a Power BI dashboard showing player rankings based on penalty-won-adjusted goals metrics.

The Winner Takes Them All (Project Map with Power BI Dashboard)
2 min

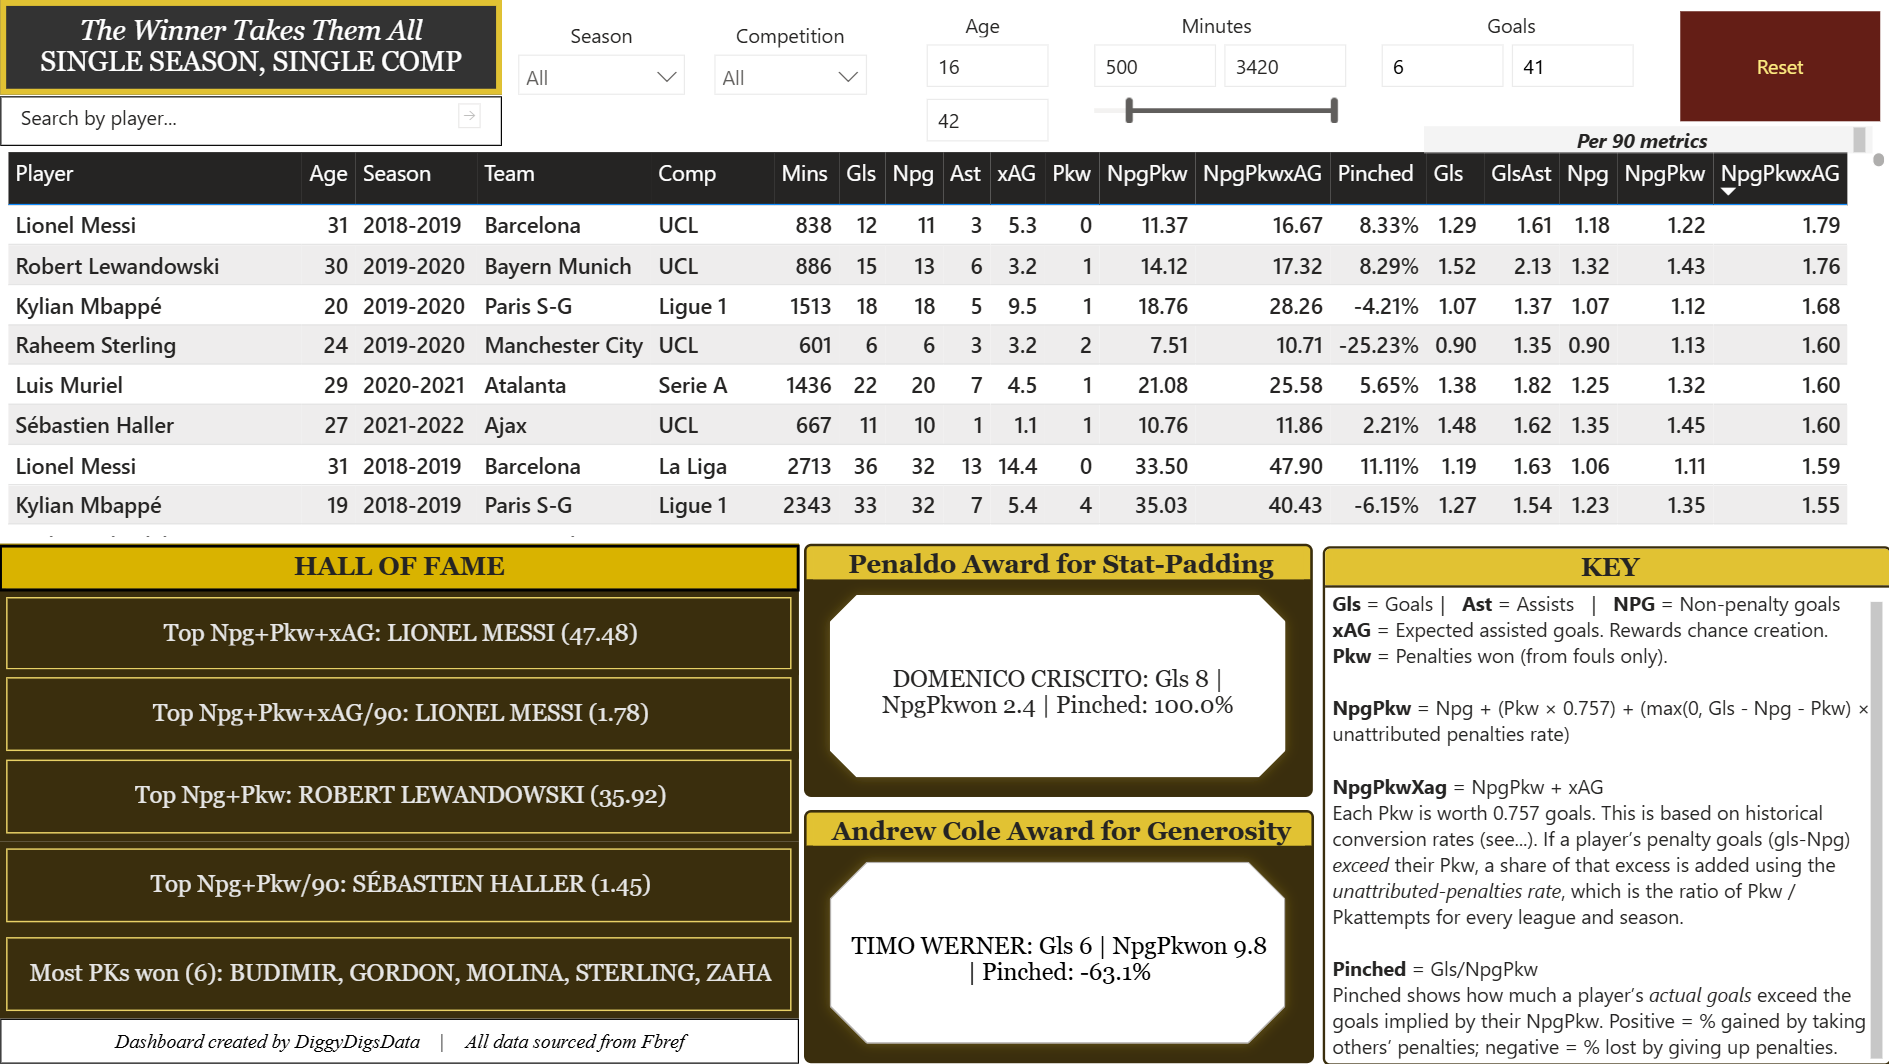
A penalty-won-adjusted goals metric, a demo Power BI dashboard, and a roadmap toward a refreshable data pipeline.

Jan 15, 2026

A picture of Stadion Za Lužánkami, formerly the 50,000 capacity home ground of Zbrojovka Brno, and now an overgrown jungle.

Too Messy to Melt (v0.1 & beta)
22 min

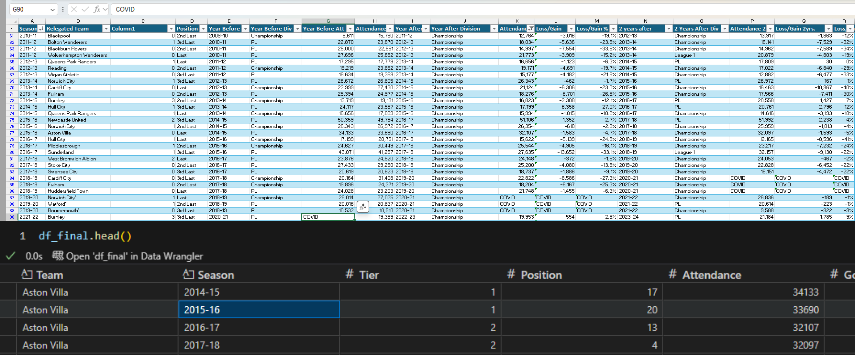
Downloadable attendance churn dataset and walkthrough of its creation - from messy and manual Excel to a tidy and reproducible Python pipeline. Includes downloadable dataset…

Jan 15, 2026

Graph of pace credits versus grade.

Grade Adjusted Pace (GAP)
8 min

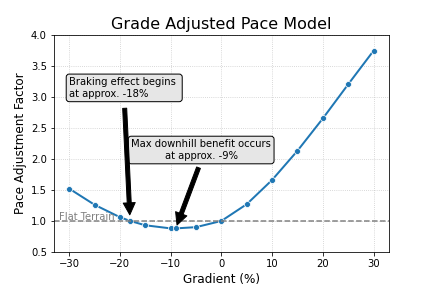
Grade Adjusted Pace estimates how fast you would have run on a flat route even if your run was on varied grades.

Nov 17, 2025

A picture of Stadion Za Lužánkami, formerly the 50,000 capacity home ground of Zbrojovka Brno, and now an overgrown jungle.

Fair-Weather Fans?
17 min

Dishing the data dirt on post-relegation loyalty.

Nov 1, 2025

A code snippet showing a possible implementation of the API.

ScraperFC API Documentation
5 min

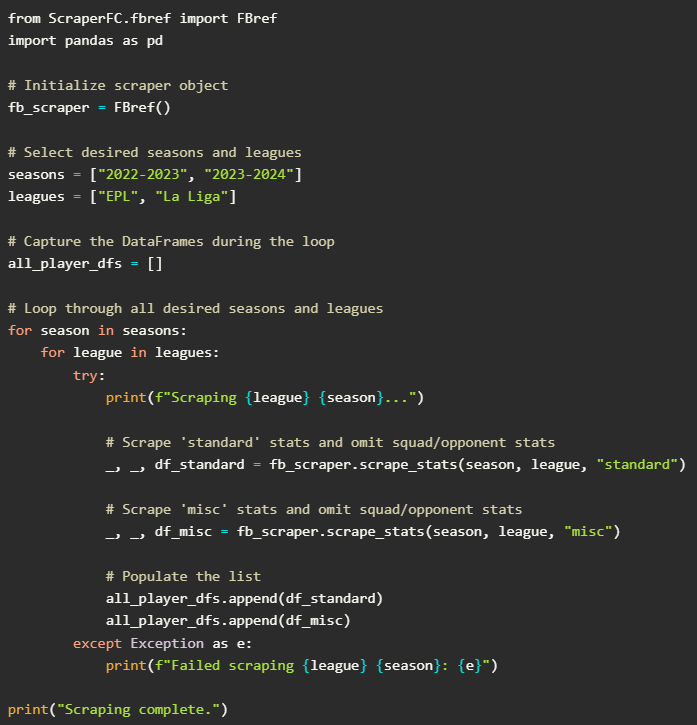
An example of API technical writing. Documents a method from the ScraperFC package (Python). Covers parameters, return types, workflow examples, error handling, versioning…

Nov 1, 2025

Lamine Yamal at a press conference.

No Fear At That Age
30 min

Testing if there’s merit to the claim that young players are fearless.

Sep 29, 2025

The Currys brand logo

Currys
1 min

Writing samples from my days as a copywriter at tech retailer Currys.

Sep 30, 2024
No matching items

This page is built with Quarto.

 
  • View source
  • License